How to Monitor your Environment
User access statistics
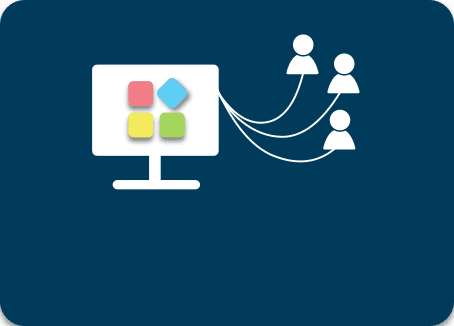
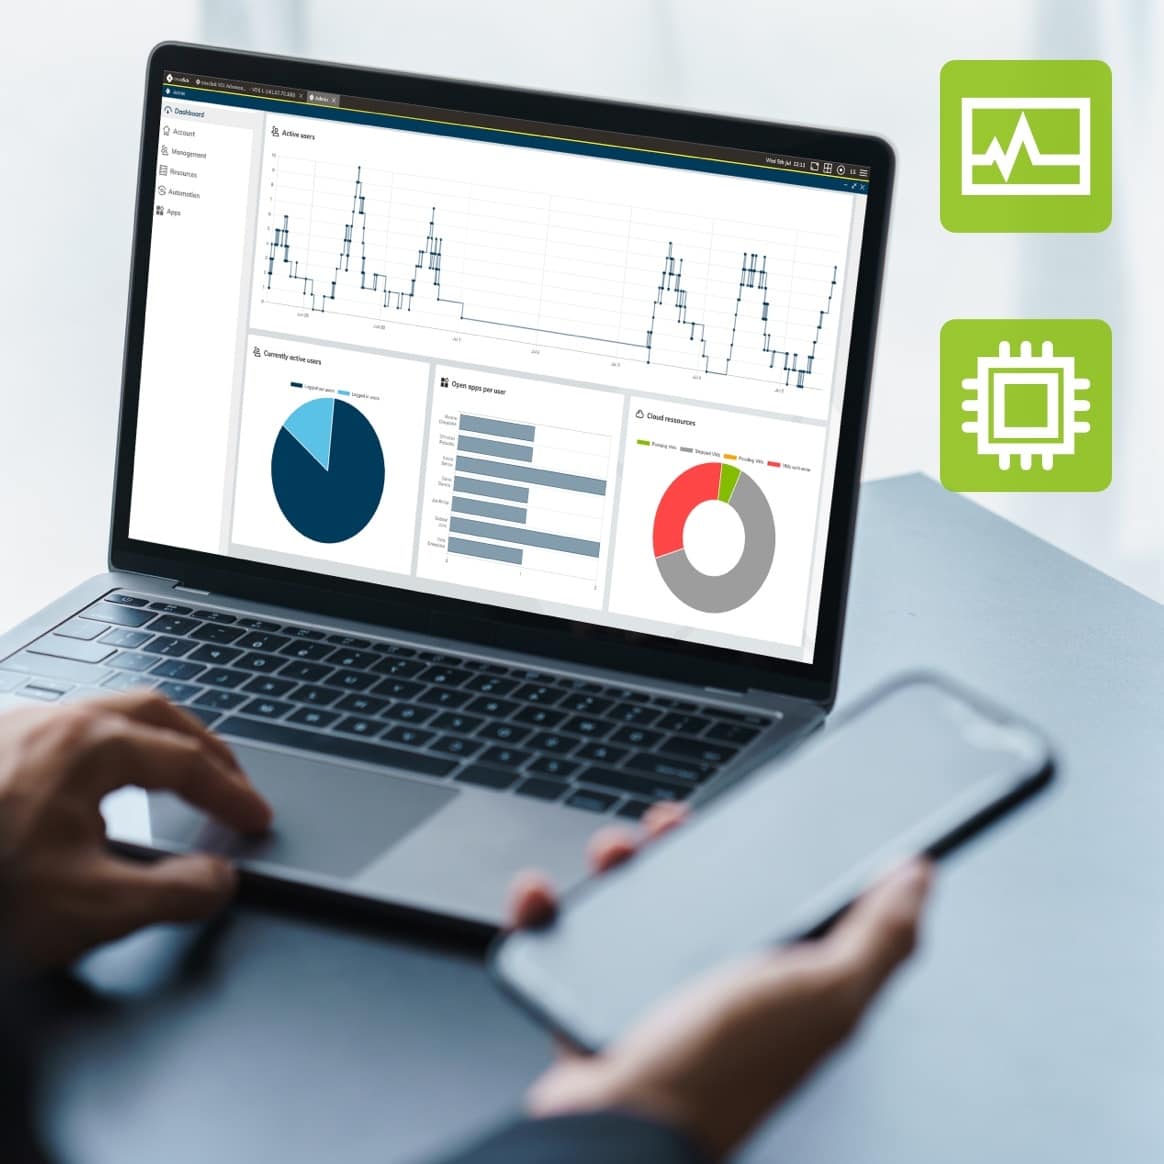
See when and how many users have accessed which connection destination for how long. You can detect usage times as well as user peaks and plan how you want to scale your resources up and down accordingly. Either with fixed event profiles or via dynamic autoscaling.
- Recognition of usage patterns
- Ideal for resource control, time tracking and license reporting
- Currently active users and active users over time
- Open applications per user
Resource utilization
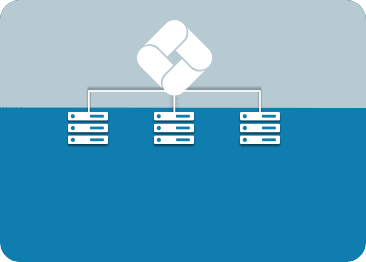
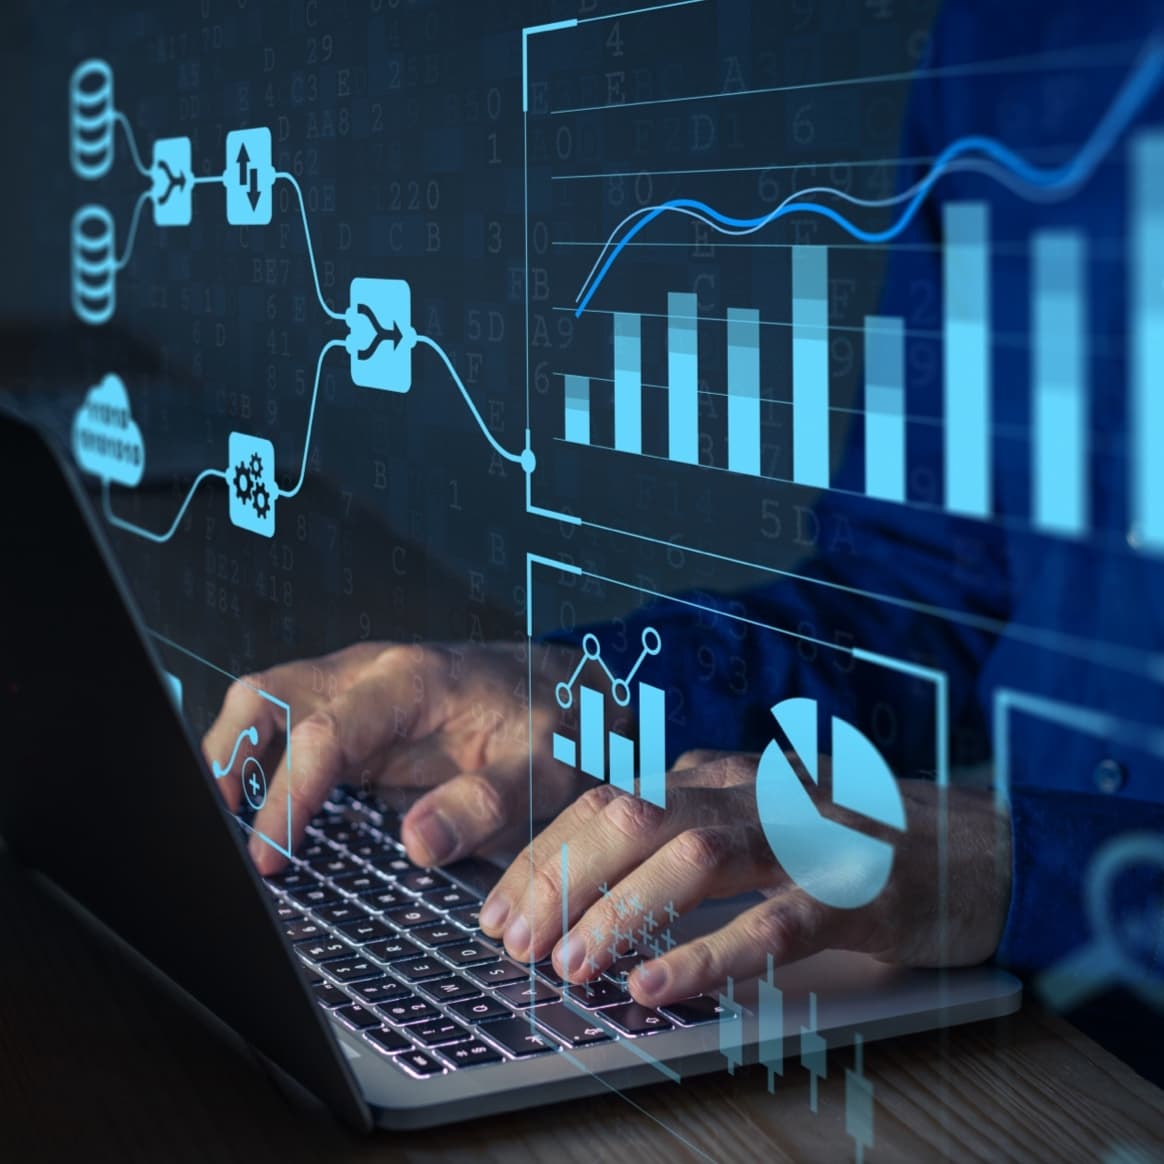
Monitor relevant metrics in real time such as CPU utilization, memory usage, network traffic and other performance indicators. This allows you to identify potential problems early before they lead to failures or performance degradation. User-friendly dashboards, give you a clear overview of the status of your systems.
- Analyze trends, peak times and bottlenecks
- Use of Prometheus, the leading open-source monitoring solution
- With Grafana integration for graphical display
- Including storage for your performance data
Alerts and notifications
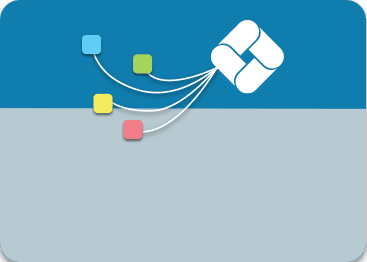
Minimize downtime, optimize performance and availability: Alerts and notifications inform you of important events or performance deviations. For example, you can set an alarm when the CPU utilization of a server exceeds a certain percentage or when the available hard disk space falls below a certain value.
- User-defined thresholds
- Notifications via e-mail, SMS or other communication channels
- Set up escalation rules
- Sending of repeated notifications if an alert is not acknowledged or resolved

